Best WiFi Heatmap Software in 2026
Four heatmapping tools stood out for real surveys, predictive planning, plus troubleshooting. NetSpot offers the best balance for most homes or smaller professional jobs.
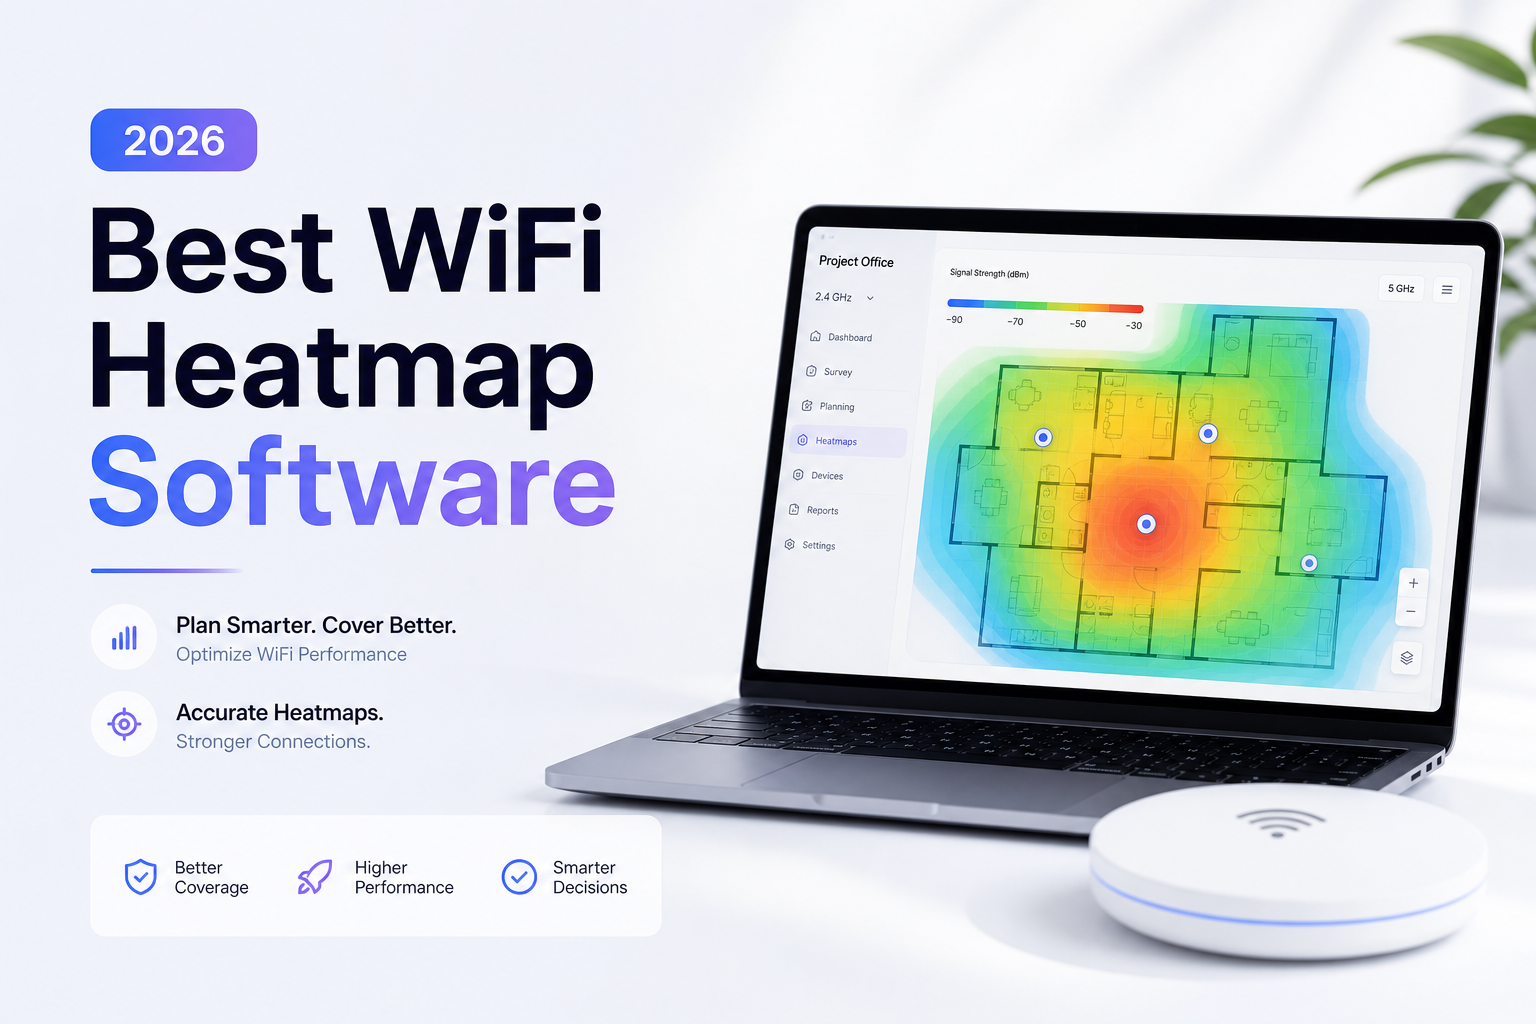
NetSpot is the best WiFi heatmap software for most people in 2026. Its guided survey workflow, 20+ measured views, predictive planning, plus one-time Pro pricing strike a practical balance. Hamina is better for design-heavy teams, while TamoGraph suits deeper field work.
NetSpot
9.2/10Best for: Home users, IT generalists, plus consultants who want approachable surveys without enterprise-level cost
- Straightforward floor-plan calibration plus walk-through surveys
- Windows plus macOS access under one desktop purchase
- 20+ measured heatmap views in Pro
- Predictive planning for proposed access-point layouts
Hamina Network Planner
8.8/10Best for: Wireless architects designing multi-floor Wi-Fi before access points are installed
- Fast browser-based predictive workflow
- Wi-Fi 7 plus 6 GHz planning
- Automated wall drawing plus AP placement
- Useful multi-floor 2D or 3D reporting
TamoGraph Site Survey
8.6/10Best for: Network consultants needing active, passive, predictive, spectrum, plus outdoor survey options
- Active, passive, predictive, spectrum, plus GPS survey modes
- Runs on current Windows plus macOS systems
- Wi-Fi 7 support
- Detailed reports with editable ODT output
Best WiFi Heatmap Software Compared
The four tools below are compared by predictive-survey support, current Wi-Fi 7 capability, entry pricing, plus overall usefulness. Scores reflect editorial judgment based on workflow, feature scope, platform access, hardware requirements, plus cost. The individual reviews explain why each product landed where it did.
| Tool | Predictive Survey | Wi-Fi 7 | Price | Score |
|---|---|---|---|---|
| 1. NetSpot PICK | ● Yes | ● Yes | $199 one-time | 9.2/10 |
| 2. Hamina Network Planner | ● Yes | ● Yes | $980/yr | 8.8/10 |
| 3. TamoGraph Site Survey | ● Yes | ● Yes | $499/6 mo | 8.6/10 |
| 4. Acrylic Wi-Fi Heatmaps | ● Yes | ● Yes | $129/1 mo | 8.1/10 |
The 4 Best WiFi Heatmap Software Tools, Reviewed
01 NetSpot
Windows, macOS, iOS, Android · Etwok
9.2/10
NetSpot
Windows, macOS, iOS, Android · Etwok
NetSpot gave us the cleanest path from a floor-plan image to a useful coverage map. During our workflow check, the survey controls required little hunting, while signal level, noise, SNR, interference, channel overlap, plus speed results were presented as separate views rather than piled onto one crowded map.
The Pro edition supports 20+ measured visualizations, up to 50 zones, 50 snapshots, plus 500 data points per snapshot. Its planning mode also covers simulated access points with nine predictive views. That is enough room for homes, schools, clinics, small offices, plus many consulting jobs. (netspotapp.com)
NetSpot is not a replacement for a dedicated spectrum analyzer or a large enterprise survey kit. Still, its mix of actual surveys, predictive planning, nearby-network inspection, clear reports, plus a $199 one-time Pro license makes it the easiest recommendation here for most readers. (netspotapp.com)
Best forHome users, IT generalists, plus consultants who want approachable surveys without enterprise-level cost
- Straightforward floor-plan calibration plus walk-through surveys
- Windows plus macOS access under one desktop purchase
- 20+ measured heatmap views in Pro
- Predictive planning for proposed access-point layouts
- Free technician license for viewing or exporting existing Pro projects
- Free desktop edition is mainly a nearby-network inspector
- Major version upgrades cost extra unless lifetime upgrades are added
- Spectrum analysis needs separate compatible hardware

02 Hamina Network Planner
Web browser · Hamina Wireless
8.8/10
Hamina Network Planner
Web browser · Hamina Wireless
Hamina is the strongest choice in this list for design-first work. We found its browser workflow especially sensible for projects that start with drawings, wall materials, capacity targets, plus proposed AP models. There is no large desktop installer to manage, so a project can be opened from another computer without moving a local application setup.
The Planner tier includes Wi-Fi 7 modeling, automated AP placement, multi-floor building models, customizable 2D or 3D reports, plus vendor export tools. Its free account allows three simulated APs plus five AI wall-drawing runs, which is useful for learning the interface before paying. (hamina.com)
The tradeoff is focus. Standard Planner is built mainly for predictive design plus analysis of imported surveys. On-site measurement requires Hamina Onsite, compatible Apple hardware, plus the separate Nomad measurement device. At $980 per year per user, Planner also makes more sense for paid network work than occasional home troubleshooting. (hamina.com)
Best forWireless architects designing multi-floor Wi-Fi before access points are installed
- Fast browser-based predictive workflow
- Wi-Fi 7 plus 6 GHz planning
- Automated wall drawing plus AP placement
- Useful multi-floor 2D or 3D reporting
- Free account supports small evaluation projects
- Standard Planner does not collect on-site measurements by itself
- Annual price is steep for home use
- Full survey kit adds a separate hardware purchase
03 TamoGraph Site Survey
Windows, macOS · TamoSoft
8.6/10
TamoGraph Site Survey
Windows, macOS · TamoSoft
TamoGraph is the most field-oriented package in the shortlist. Its workflow covers passive scanning, active throughput checks, predictive modeling, automatic AP location, spectrum data, plus GPS-assisted outdoor collection. Reports can be produced as PDF, HTML, or editable ODT files. (tamos.com)
In the same office-plan exercise, TamoGraph exposed more radio plus adapter controls than NetSpot. That helps experienced surveyors, though it creates a busier first hour. The current release supports Wi-Fi 7, including 2.4, 5, plus 6 GHz work where the selected adapter plus local rules permit it. (tamos.com)
Pricing starts at $499 for six months for Pro. A perpetual Pro license costs $1,999. Hardware compatibility deserves attention before purchase, particularly on Windows, since monitor-mode behavior varies between adapter revisions. (tamos.com)
Best forNetwork consultants needing active, passive, predictive, spectrum, plus outdoor survey options
- Active, passive, predictive, spectrum, plus GPS survey modes
- Runs on current Windows plus macOS systems
- Wi-Fi 7 support
- Detailed reports with editable ODT output
- Perpetual license remains available
- Interface takes longer to learn than NetSpot
- Some Windows adapters have monitor-mode limits
- Spectrum analysis requires extra hardware
04 Acrylic Wi-Fi Heatmaps
Windows · Tarlogic
8.1/10
Acrylic Wi-Fi Heatmaps
Windows · Tarlogic
Acrylic Wi-Fi Heatmaps has a distinctly technical Windows workflow. Basic covers unlimited site surveys, 11 heatmap types, Wi-Fi 7 planning, automatic coverage validation, plus editable reports. Advanced raises the selection to 15 heatmap types, then adds monitor mode, SNR analysis, spectrum-analyzer support, plus connected-client identification. (store.acrylicwifi.com)
We liked the ability to move from predictive placement to measured validation without switching products. Advanced is the more interesting edition for consultants since packet-level visibility plus client detection can explain problems that a simple signal-strength map misses.
The rough edges are price plus platform scope. Acrylic is Windows-only, while the shortest Basic term costs $129 for one month. The annual Basic option works out to $69 per month, but that commitment is harder to justify for a one-off home survey. (store.acrylicwifi.com)
Best forWindows-based surveyors who need monitor-mode capture plus editable client reports
- Wi-Fi 7 predictive design
- Unlimited site surveys in paid editions
- Editable reports
- Advanced monitor mode across all three Wi-Fi bands
- Broad compatible-card list for Advanced users
- Windows only
- Annual commitment needed for the lower monthly rate
- Advanced capture features require compatible hardware
How We Evaluated the Best WiFi Heatmap Software of 2026
We compared each product through a common office-survey workflow: importing a scaled floor plan, marking walls, placing proposed access points, checking 2.4 GHz plus 5 GHz coverage, reviewing 6 GHz or Wi-Fi 7 support, then producing a report. We also looked at how clearly each tool separates signal strength, noise, SNR, interference, channel overlap, plus throughput data.
Scores considered setup effort, heatmap usefulness, predictive options, measured-survey support, operating-system coverage, hardware dependencies, report output, plus verified July 2026 pricing. A tool did not gain points merely for offering more views. The views had to help answer a practical question, such as where coverage drops or why two nearby APs compete.
How to Choose WiFi Heatmap Software for Your Building
Start with the job. A homeowner fixing one dead zone needs easy floor-plan calibration plus clear signal maps. A consultant validating a warehouse may need monitor mode, external adapters, spectrum capture, GPS, editable reports, plus repeatable snapshots. Predictive-only tools are useful before installation, but they do not prove how the finished network behaves around shelving, people, doors, machinery, or neighboring networks.
Check platform plus adapter compatibility before comparing prices. A cheaper license is wasted if your laptop cannot capture the required bands. For 6 GHz work, verify the exact adapter revision, operating system, regulatory region, plus whether the tool measures 6 GHz or merely simulates it.
Common WiFi Heatmap Survey Mistakes to Avoid
Do not treat a bright signal map as proof of good service. A room can show strong RSSI yet suffer from interference, poor SNR, overloaded channels, weak roaming behavior, or low throughput. Review several maps from the same survey rather than choosing the prettiest one.
Floor-plan scale matters too. A small calibration error changes estimated distances across the whole project. Walk at a steady pace, sample both sides of dense walls, keep the laptop in a consistent position, then repeat important areas during normal occupancy. A silent office at 6 a.m. may produce a very different result from the same office during a full workday.
Which WiFi Heatmap Tool Should You Choose?
NetSpot earns first place because it turns floor plans plus walk-through readings into understandable maps without the price or setup burden of a dedicated enterprise kit. Pick Hamina when predictive design is the main job, TamoGraph for demanding indoor or outdoor field surveys, or Acrylic if your workflow is firmly Windows-based plus monitor mode matters. Your laptop, Wi-Fi adapter, building size, plus reporting needs should carry more weight than the longest feature list.Import one real floor plan into your top two trial versions, then confirm adapter support plus report quality before buying a license.